

2.1.4.2. Standardized Precipitation Index
The Standardized Precipitation Index (SPI) is a widely used metric for assessing and monitoring drought conditions and other precipitation anomalies. It quantifies the deviation of observed precipitation from its long-term average for a specific location and time period, normalized by the standard deviation. SPI is designed to make the relative intensities of droughts and wet periods comparable across different climates, from arid to humid areas. A drought condition identified by a certain value of the SPI is expected to happen anywhere with comparable frequency.
The index is flexible and can be computed for various timescales, between one month and several years. The choice of timescale depends on the type of drought or precipitation anomaly being monitored:
• Short-term SPI (1-3 months): useful for monitoring soil moisture and agricultural drought.
• Medium-term SPI (6-12 months): to assess impacts on water resources, streamflow, and reservoir levels.
• Long-term SPI (24 months or more): reflects prolonged droughts affecting groundwater and large-scale hydrological systems.
The standardization process involves fitting the precipitation data to a probability distribution, usually a Gamma distribution, and then transforming it into a normal distribution. To compute the index, a Gamma distribution is fitted to the non-zero precipitation totals of all the years falling into a reference period, normally at least 30 years. The fitted distribution, together with the probability of precipitation being greater than zero, permits to calculate the probability that a certain precipitation total is exceeded. This probability is then interpreted as applying to a standard normal distribution and converted into a deviation from the mean in multiples of the standard deviation: the SPI.
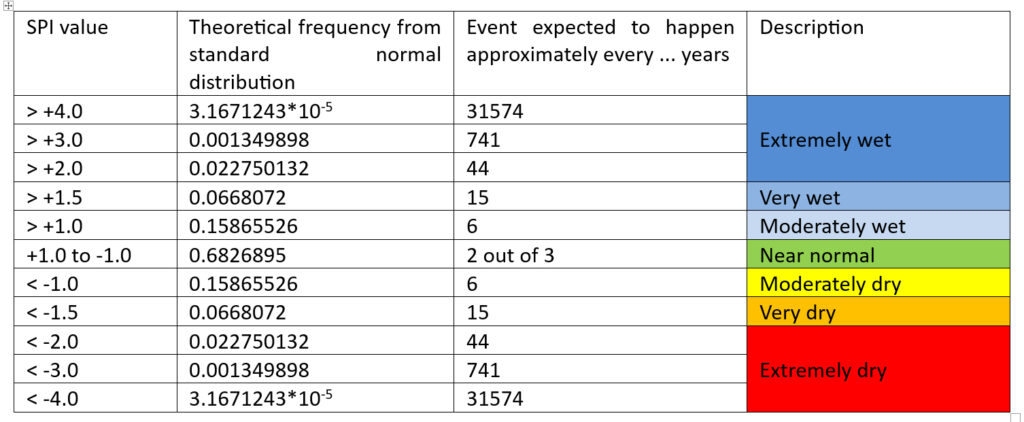
If the combined model – probability of precipitation greater than zero and Gamma distribution fitted to non-zero values – is a perfect fit for precipitation at a site, the standard normal distribution provides direct information on the expected frequencies of drought or high-rainfall events associated with a certain SPI value (see Table 3).
The accuracy of the SPI depends on the quality and length of the precipitation record. It is less reliable in regions with sparse data or short records, but also in very arid areas where it becomes without real meaning. The SPI’s main limitation is that it only considers precipitation data and does not account for other factors such as temperature, evapotranspiration, or soil moisture, which can also influence drought conditions. An index that takes better these factors into consideration is the Standardized Precipitation-Evapotranspiration Index (SPEI)
NOTES:
Pub.109, Section 3.2.2. provides formulas for the SPI calculation. An example of SPI calculations in Excel, using 522 data points from West Asia, is available here.
Pub.94 provides examples of SPI maps for Central Asia and Xingiang Province for two consecutive years, the first one (Sep 1985-Aug 1986) normal to very dry, the second one (Sep 1986-Aug 1987) normal to very wet.
This poster presents a set of SPI maps for Africa covering the period from 1901 to 2010. (I plan to update it in 2025!).