

2.1.5.2.2. Spectral (Fourier) Analysis
Fourier analysis is a powerful tool for identifying and understanding periodicities and trends in climatic time series data. It allows complex time series, characterized by high internal variability, to be decomposed into frequency components, making it easier to identify underlying periodic patterns.
The core tool in Fourier analysis is the Fast Fourier Transform (FFT), a highly efficient algorithm that converts a finite sequence of equally spaced time-domain samples into the frequency domain. It breaks down a signal into its constituent sinusoidal components (sine and cosine waves) of varying frequencies, amplitudes, and phases.
The FFT represents the signal as a sum of these frequency components, revealing the contribution (magnitude) of each frequency to the overall time series pattern.
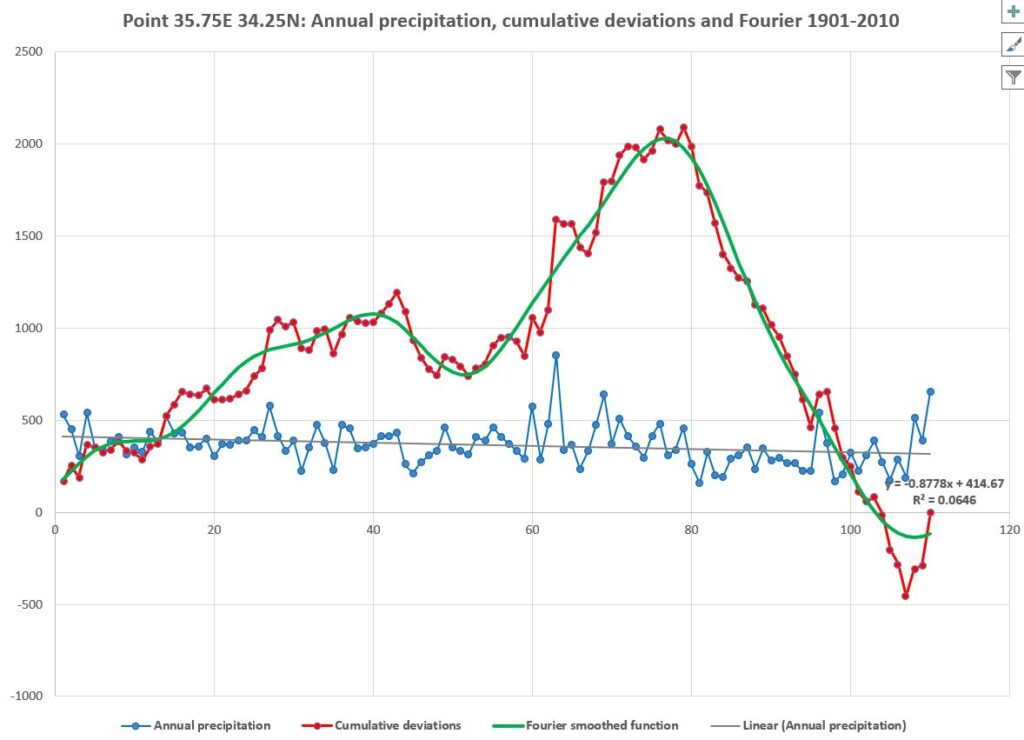
In this example (Fig. 6) the first five frequencies contribute the most to the overall pattern of cumulative deviations of annual precipitation in location 35.75E – 34.25N, whereas the higher frequencies merely represent noise that can be filtered out. The smoothed approximation of the time series of cumulative deviations (the green line in Figure 6) can then be generated by reconstructing the time-domain signal with only the highest contributing frequencies.
By eliminating insignificant high-frequency components, data can be compressed to retain only the most meaningful signals and is efficiently done using the Inverse Fourier Transform (IFFT). Both FFT and IFFT can be implemented in Excel, which has been used in the above example.
NOTES
1. A good explanation of the steps involved can be found in FFT in Excel for spectral analysis
2. For an explanation of why combining FFT and IFFT is beneficial, see The inverse Fourier transform