

2.1.5.2. Assessing Current Chimate Change
Meteorological stations worldwide provide long-term records of temperature, precipitation, and atmospheric pressure, offering crucial data on trends and anomalies. In addition to land-based meteorological data, satellites monitor key climate variables, such as sea surface temperatures, ice cover, and atmospheric composition, enabling global-scale observations. Ocean buoys and ship-based measurements track changes in sea level, temperature, and salinity.
Additional tools for studying climatic variability worldwide are the global reanalysis datasets. These datasets integrate historical weather observations with modern numerical weather prediction (NWP) models. The core idea behind reanalysis is to generate a consistent, long-term record of the Earth’s atmosphere, ocean, land, and other environmental variables by using a fixed, state-of-the-art modeling system to ‘reanalyze’ past weather and climate data.
More info on reanalysis datasets
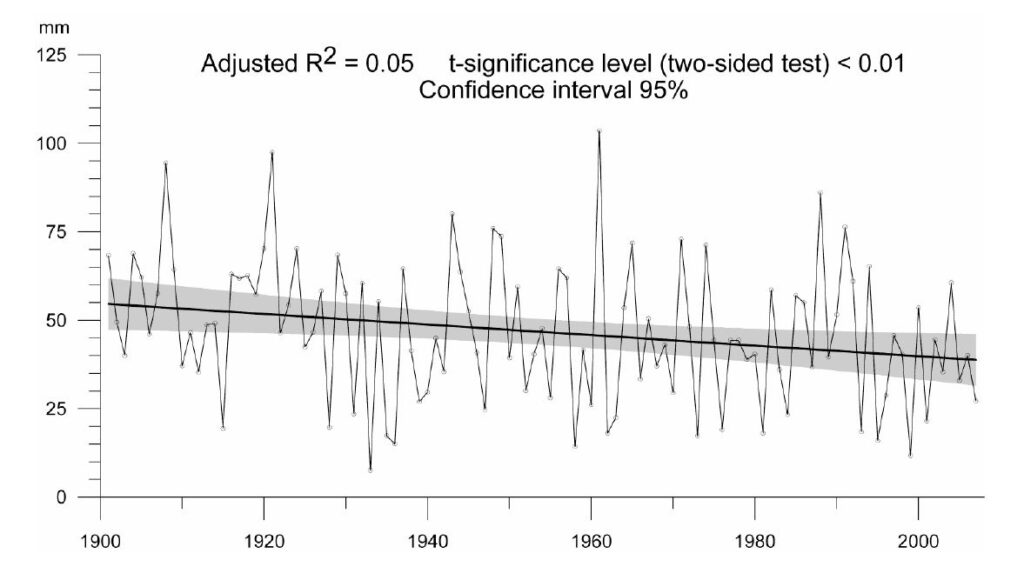
Climate change over the past century can readily be assessed using basic statistical tools for trend analysis. A first step is to identify trends, which may be linear or take more complex forms, such as logarithmic or exponential. Figure 10 illustrates a linear trend in a 100-year series of annual precipitation in Egypt. The high interannual variability in precipitation, typical of arid, semi-arid, or monsoonal climates, results in a low R² value for the linear trend. Nevertheless, the negative trend is clear and highly significant.
Next, one might explore periodicities within the time series, which could indicate recurring and potentially predictable patterns of higher and lower values. While temperature variations related to annual cycles and daily fluctuations are well understood, precipitation patterns, especially those showing long-term fluctuations beyond seasonal variations, are less clear.
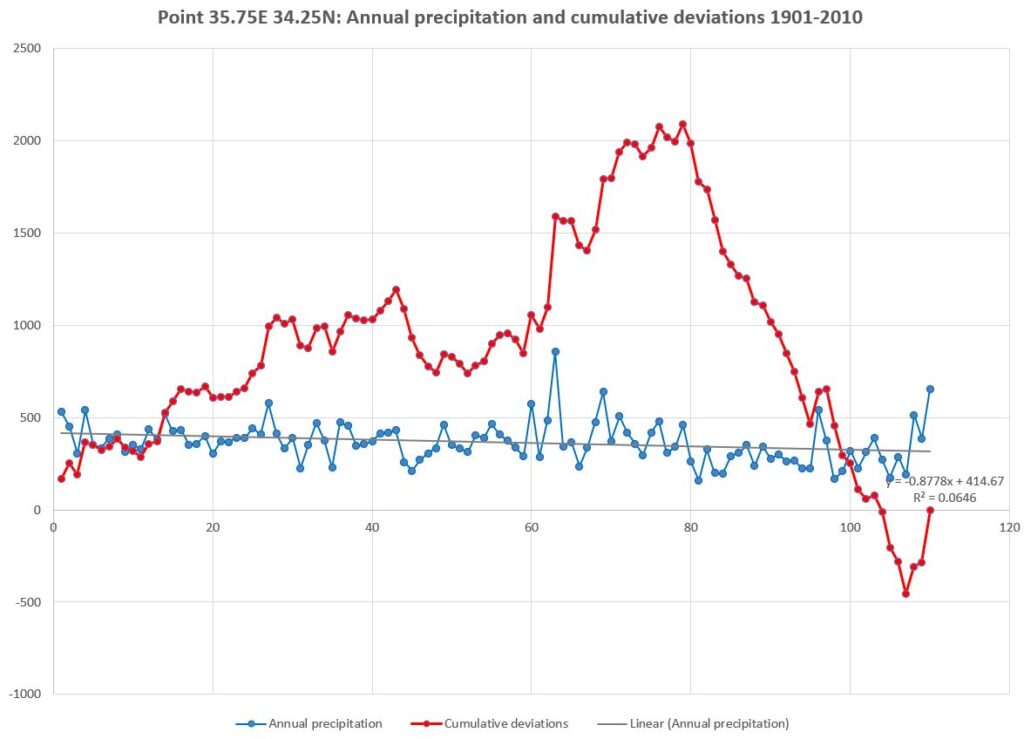
Figure 11 shows a long-term periodicity in the precipitation pattern for a location in western Lebanon, analyzed in Excel. The jagged blue line represents annual precipitation variations, while the grey line shows a negative and highly significant linear trend, similar to Figure 4. The strongly upward-curving red line represents cumulative deviations from the series mean. This method is valuable in time series analysis for visualizing and interpreting longer-term fluctuations: positive cumulative deviations indicate a generally increasing series, while negative deviations suggest a downward trend. In the example in Figure 5, there is a general upward trend until 1979, followed by a downward trend through the end of the series. Secondary trend inflections, such as those between 1943 and 1952, interrupt the general trend.
By using a Fast Fourier Transform this jagged pattern can be simplified, allowing a clearer view on possible cyclicity in the precipitation pattern.
More on this topic in the section on Spectral (Fourier) Analysis