
Implementing Integrated Land Use Planning: A step-by-step guide for rural areas
PRACTITIONER’S GUIDE: STEP 4
PART 4
4.1.5. Transforming raw characterization data into an initial situation assessment
Once all available raw data have been compiled—in various formats—it is essential to process them in a way that enables an initial holistic assessment of how the land, land use, and land users/stakeholders interact as integrated systems.
Two approaches are particularly useful for this purpose:
• One emphasizes the economic–ecological dimensions of the land.
• The other focuses on socio-economic aspects.
Both approaches can be (and have been) implemented participatorily, for example through workshops involving Task Force members, technical experts, government representatives, NGOs, and local key informants.
4.1.5.1. Economic–Ecological Zones (EEZ)
The EEZ approach, proposed by Biancalani et al. (2004) for a municipality in Bosnia-Herzegovina, aggregates biophysical and economic data into easily understandable and readily usable maps. It also supports a basic SWOT analysis by broadly identifying development potentials, constraints, opportunities, and threats.
The EEZ are coarse subdivisions of the municipality, characterized by similar economic–ecological conditions. Although the boundaries between zones can be subjective, this is not a major drawback: the goal is to compile readily available data quickly to kick-start the land use project. In the Sanski Most case study (Fig.18), the zone boundaries are not artificial, as they reflect natural patterns—in this case, broad land cover classes derived from satellite imagery. In areas where satellite imagery does not yield useful differentiation (e.g., due to fragmented land cover), alternative criteria may be more suitable for delineating EEZ.
The EEZ approach is primarily an exploratory tool for rapid characterization of land and land use. Although initially developed at municipal level, it can also be applied at national or sub-national scales.
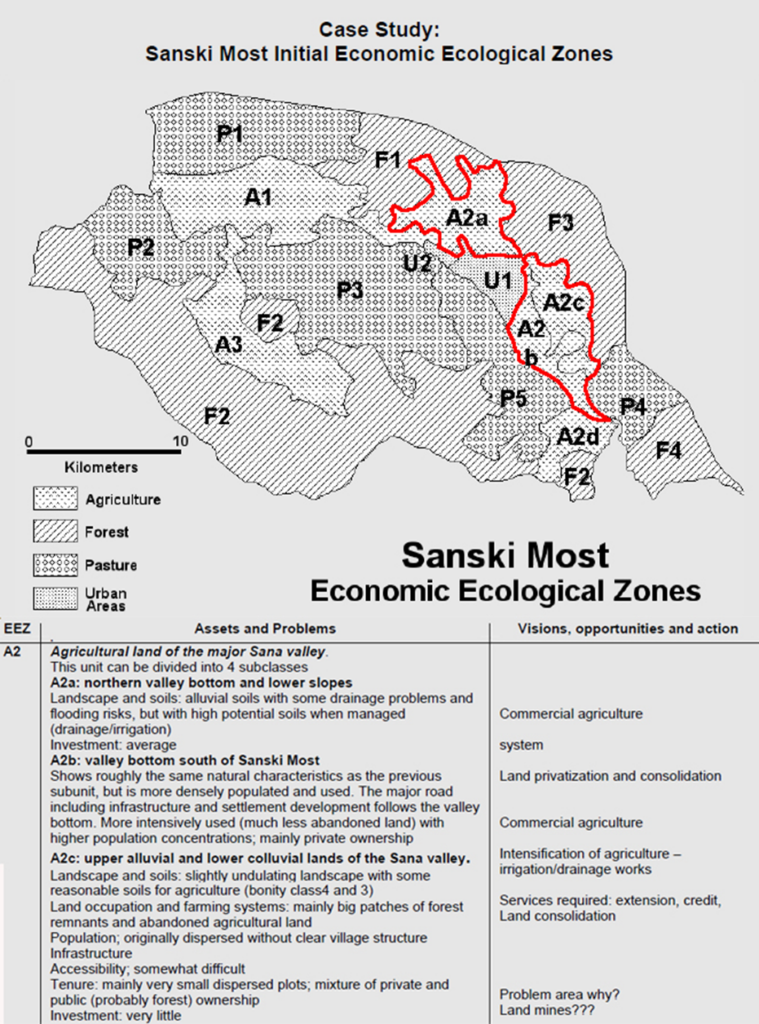
Note: Areas delineated in red correspond to the portions of the legend shown in the figure.
4.1.5.2. Livelihood Zones (L-Zones)
The Livelihood Zones approach was developed by USAID FEWS as a mapping tool to create food security vulnerability profiles, primarily for African countries. L-Zones are delineated based on socio-economic factors—such as farming systems, market accessibility, and major economic activities—alongside biophysical elements, including agroclimatic conditions, soil patterns, elevation, and land cover.
These elements are integrated into livelihood descriptions, summarizing the key characteristics of each zone. In some cases, maps are accompanied by livelihood profiles, which provide in-depth descriptions of wealth groups within each zone (Box 13).
Box 13. Livelihood Zones of Guinea 2016 (source: USAID FEWS.NET)
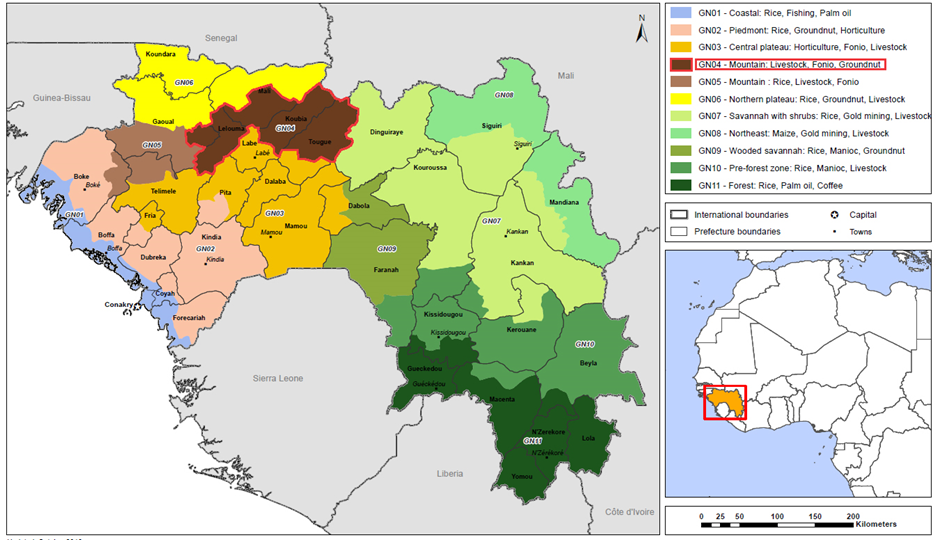
| Zone GN04 Mountain (Livestock, fonio, groundnuts) Typical L-zone description format: • General descriptions of environment (rainfall and temperature regimes, landforms, soil types and quality, population, land uses) • Disaggregated by poor and better-off households: —–Main productive assets —–Main food and food sources —–Main income sources • Main markets • Main hazards for food security • Coping strategies • Crop calendars • Food and income calendar for poor households |
Although initially designed for food security monitoring, the L-Zone approach—due to its broad overview of livelihoods and socio-economic structures—is also valuable for synthesizing diverse data sources in national-level land use planning.
Given the dynamic nature of socio-economic conditions, L-Zone maps are not static and may require regular updates.