

2.2.2.4. Integrated Analysis of Vulnerability to Climate Risks: an example using ND-GAIN
The Notre Dame Global Adaptation Initiative’s (ND-GAIN) Country Index is a free, open-source index that shows a country’s current vulnerability to climate disruptions. It also assesses a country’s readiness to leverage private and public sector investment for adaptive actions. The ND-GAIN Country Index brings together more than 40 core indicators to measure vulnerability and readiness of 182 UN countries from 1995 to the present (University of Notre Dame, 2024).
ND-GAIN offers an interesting example of how an integrated multidisciplinary analysis of climatic vulnerability can be undertaken. The following text is entirely based on the Technical Report.
The ND-GAIN framework adheres to the IPCC framework measuring vulnerability through its components ‘exposure’, ‘sensitivity’ and ‘adaptive capacity’, and adds a measure of ‘readiness’ by means of economic, governance and social components.
Vulnerability
ND-GAIN assesses the vulnerability of a country by considering six life-supporting sectors: food, water, health, ecosystem services, human habitat and infrastructure. Each sector is in turn represented by six indicators for each of the three cross-cutting components, exposure, sensitivity, and adaptive capacity.
Readiness
ND-GAIN understands by ‘readiness’ the ability to make effective use of investments for adaptation actions thanks to a safe and efficient business environment. ND-GAIN measures overall readiness by considering three components: economic readiness, governance readiness and social readiness.
• Economic Readiness: The investment climate that facilitates mobilizing capitals from private sector.
• Governance Readiness: The stability of the society and institutional arrangements that contribute to the investment risks. A stable country with high governance capacity reassures investors that the invested capitals could grow under the help of responsive public services and without significant interruption.
• Social readiness: Social conditions that help society to make efficient and equitable use of investment and yield more benefit from the investment.
Figure 13. summarizes the framework of ND-GAIN indicators.
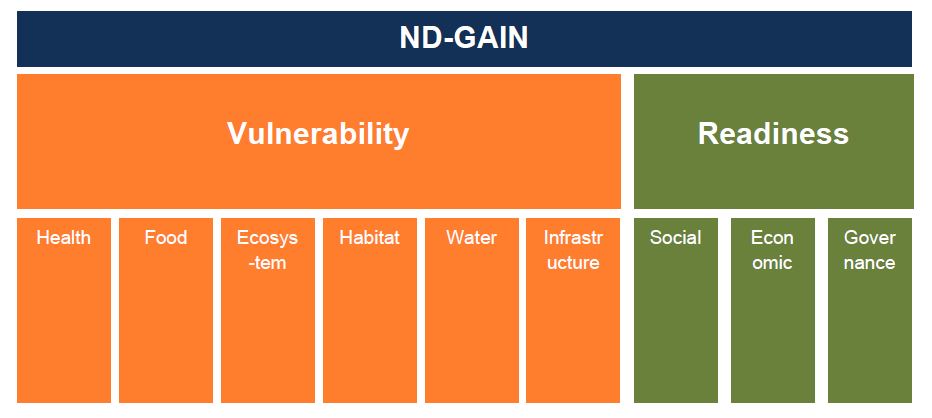
Vulnerability is composed of 36 indicators. Each component has 12 indicators, crossed with 6 sectors. Readiness is composed of 9 indicators. The 45 ND-GAIN indicators come from 74 data sources that provide 74 underlying data. 20 of the 45 indicators come directly from the sources; the rest 25 are computed by compiling underlying data.
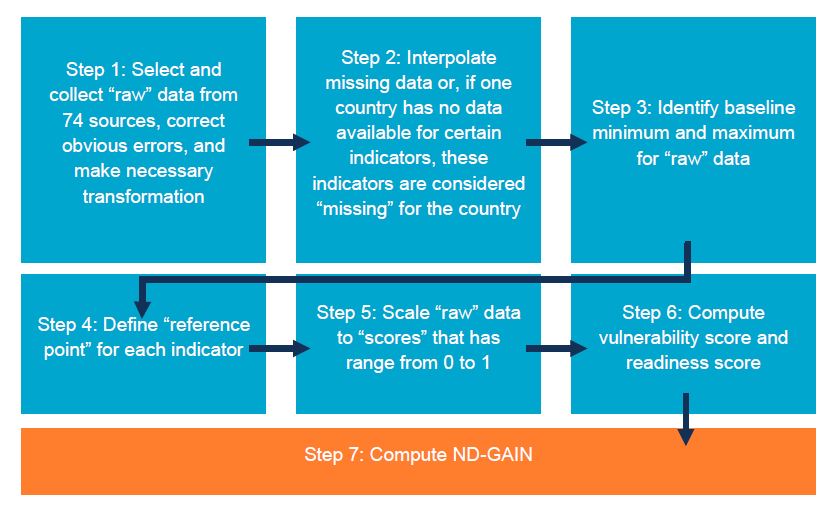
The procedure for data conversion to index is summarized in Figure 14. and described in the Technical Report pp 9-11.
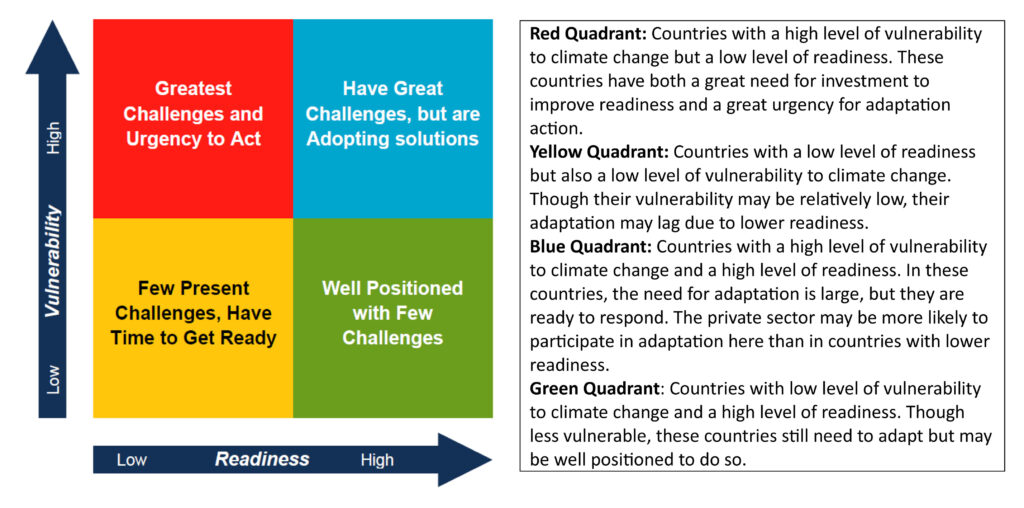
ND-GAIN can be represented as a scatter plot of readiness against vulnerability, that is, the ND-GAIN Matrix (Fig. 15). The Matrix provides a visual tool for quickly comparing countries and tracking their progress through time. The plot is divided into four quadrants, delineated by the median score of vulnerability across all the countries and overall years, and the median score of readiness calculated the same way.
The 45 indicators used in the ND-GAIN index are listed in Tables 20 and 21. The Technical Report provides for each one a description, rationale, calculation, data source, and time series. In addition, it explains the scaling mechanism (the ‘proximity-to-reference point’ approach) used for scoring the level of vulnerability and readiness for each indicator.
| Sector | Exposure component | Sensitivity component | Adaptive capacity component |
| Food | Projected change of cereal yields | Food import dependency | Agriculture capacity (fertilizer, irrigation, pesticide, tractor use |
| Projected population change | Rural population | Child malnutrition | |
| Water | Projected change of annual runoff | Fresh water withdrawal rate | Access to reliable drinking water |
| Projected change of annual groundwater recharge | Water dependency ratio | Dam capacity | |
| Health | Projected change of deaths from climate change induced diseases | Slum population | Medical staffs (physicians, nurses, and midwives) |
| Projected Change in Vector Borne Disease | Dependency on external resource for health services | Access to improved sanitation facilities | |
| Ecosystem services | Projected change of biome distribution | Dependency on natural capital | Protected biomes |
| Projected change of marine biodiversity | Ecological footprint | Engagement in international environment conventions | |
| Human habitat | Projected change of warm period | Urban concentration | Quality of trade and transport-related infrastructure |
| Projected change of flood hazard | Age dependency ratio | Paved roads | |
| Infrastructure | Projected change of hydropower generation capacity | Dependency on imported energy | Electricity access |
| Projected change of sea level rise impacts | Population living under 5m above sea level | Disaster preparedness |
| Component | Indicators | |||
| Economic Readiness | Doing business | |||
| Governance Readiness | Political stability and non-violence | Control of corruption | Rule of law | Regulatory quality |
| Social Readiness | Social inequality | ICT infrastructure | Education | Innovation |
ND-GAIN: Evaluation
The ND-GAIN Index is a valuable tool for understanding global variations in climate vulnerability and readiness. By integrating these two dimensions, it provides a comprehensive view of climate risks and enables meaningful comparisons between countries. Its sector-specific insights, combined with a timeline feature, allow users to track progress in climate action over time.
However, like all indices that rely on country-level statistics, the ND-GAIN Index faces challenges related to data gaps, particularly in poorer countries with high vulnerability and low readiness. The selection of indicators prioritizes cross-country comparability, which may limit their relevance for specific national contexts.
For assessments within individual countries, the ND-GAIN concepts and methodology remain highly useful. However, careful attention must be given to selecting the most relevant indicators, ensuring they are based on reliable data sources that support consistent comparisons across different geographical entities.